Apache JMeter: The Performance and Load Testing Weapon for Applications
I. Introduction to Apache JMeter
Apache JMeter is an open-source tool developed by the Apache Software Foundation. Apache JMeter is used for performance and load testing of web applications, APIs, databases, and many other protocols.
Initially, JMeter was designed for web applications but has become popular in the software testing community after successfully expanding into a free tool to support various types of services.
II. Key Features of Apache JMeter
1. Load Testing
Simulates thousands of virtual users accessing the system simultaneously to test its load-bearing capacity.
2. Supports Multiple Protocols
JMeter measures response time, throughput, resource usage, and other metrics under various conditions. Supported protocols include:
- HTTP, HTTPS (Web and Mobile)
- SOAP, REST (API)
- FTP, TCP, SMTP, IMAP (Email)
- JDBC (Databases), WebSocket, JMS, LDAP,…
3. Multithreading
Allows simultaneous execution of different test scenarios using separate threads.
4. Detailed Reporting
Provides graphical reports and detailed statistics of the test results, such as response time, throughput, error count, and other key metrics.
5. Easily Extensible
Allows adding plugins to enhance functionality and integrates well with various DevOps and CI/CD tools.
III. Architecture of Apache JMeter
1. Test Plan
This is the structure of JMeter’s testing, including test elements like Thread Group, Samplers, Listeners, and other configurations.
2. Thread Group
Simulates the number of virtual users (threads) executing test scenarios.
3. Samplers
Used to send requests to the server during testing, supporting various protocols like HTTP, FTP, JDBC,…
4. Timers
Allows adding wait times between requests to simulate the real behavior of users.
5. Assertions
Ensures that the server’s response is correct, helping verify the accuracy of the response data.
6. Listeners
Components that collect data and display the test results in graphs or reports.
IV. Limitations of Apache JMeter
1. User Interface (UI)
Although the interface is user-friendly, JMeter sometimes faces limitations when handling complex test scenarios with a visual interface.
2. Performance Limitations with Large Tests
When testing with a large number of users (hundreds of thousands), JMeter may struggle due to high resource consumption (CPU and RAM).
3. No UI Testing Support
JMeter primarily tests the backend and does not provide good support for testing applications with user interfaces.
V. Real-World Applications of Apache JMeter
Load Testing for Websites: Simulates thousands of users accessing a website simultaneously to assess the response speed and system load capacity.
API Evaluation: Sends numerous requests to an API to test its stability and response time.
Database Testing: Evaluates the performance of SQL queries or database operations.
VI. Installing Apache JMeter
Apache JMeter is written in Java, so to run JMeter, your machine must first install JRE or JDK.
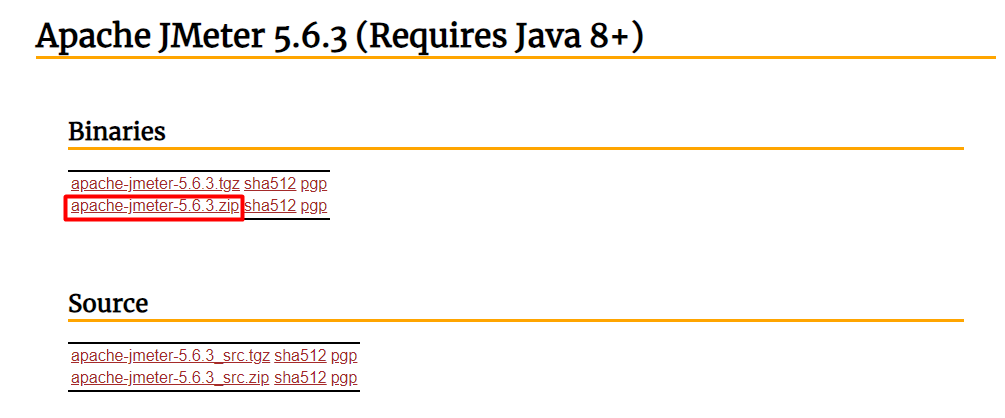
Visit the website: http://jmeter.apache.org to download Apache JMeter.
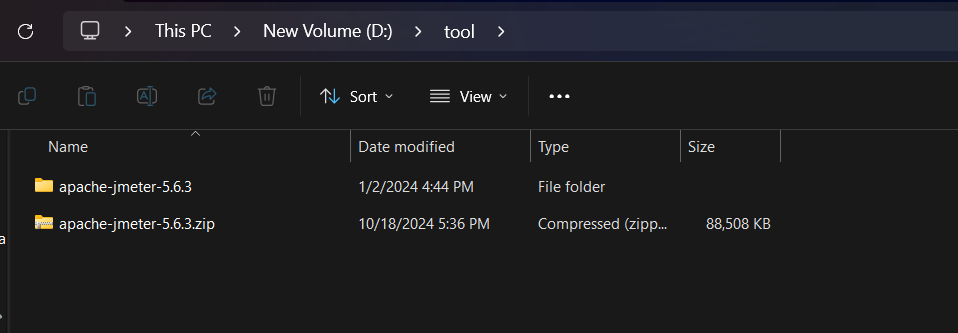
Extract the zip file you just downloaded.
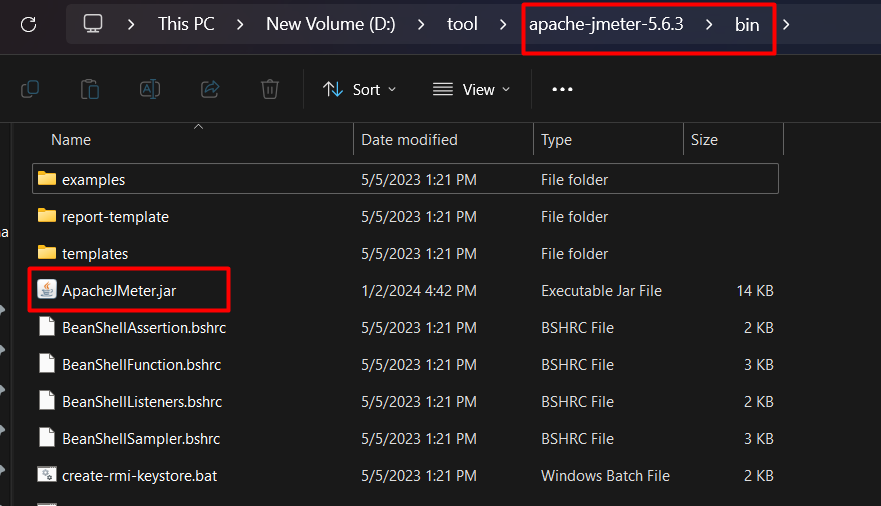
Navigate to the bin folder → double-click the ApacheJMeter.jar file to run Apache JMeter.
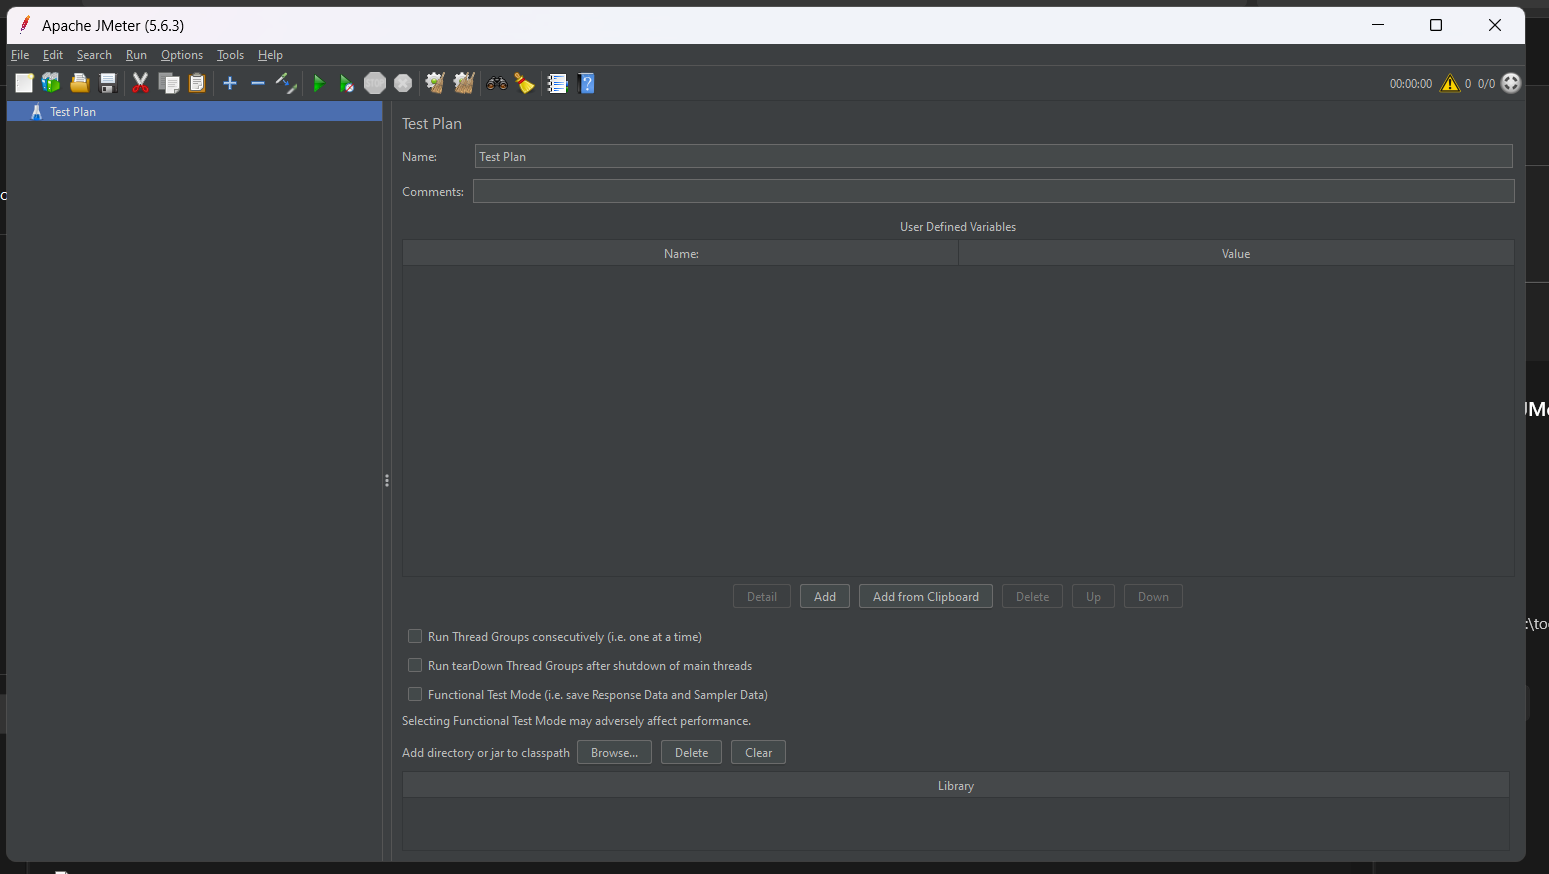
The application interface.
VII. Load Testing Guide for Google
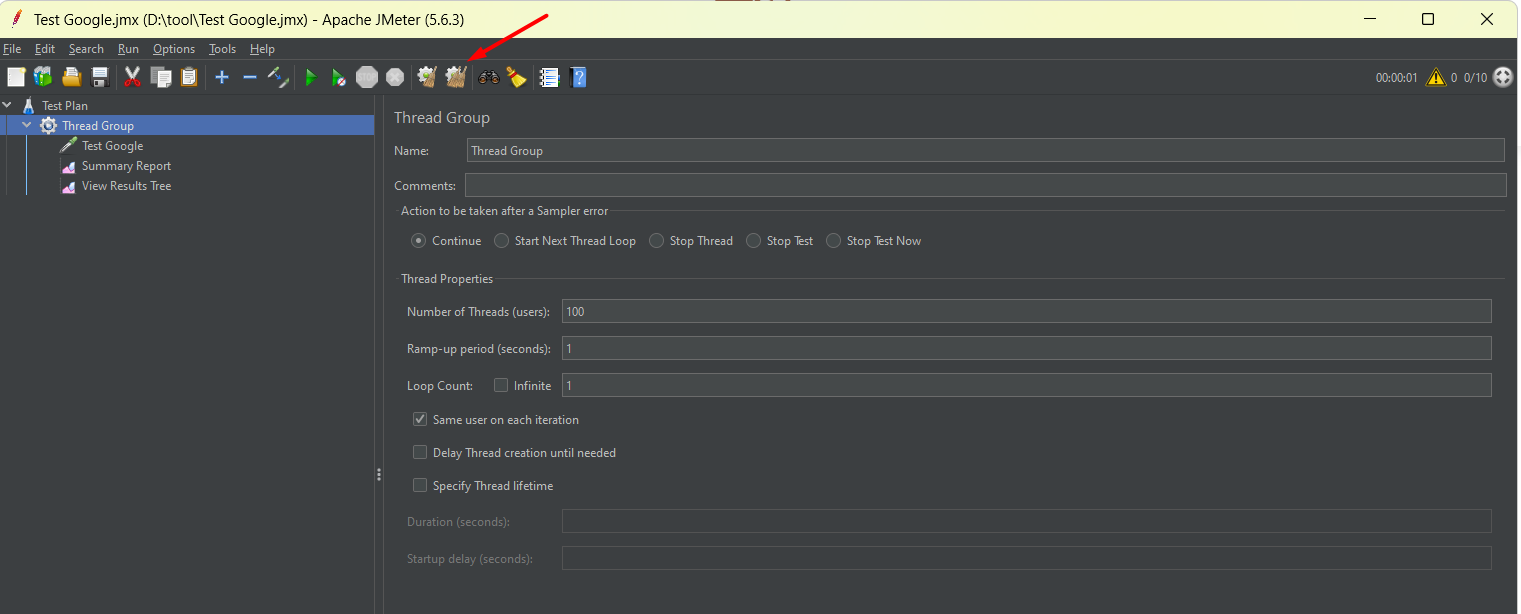
1. Creating a Thread Group
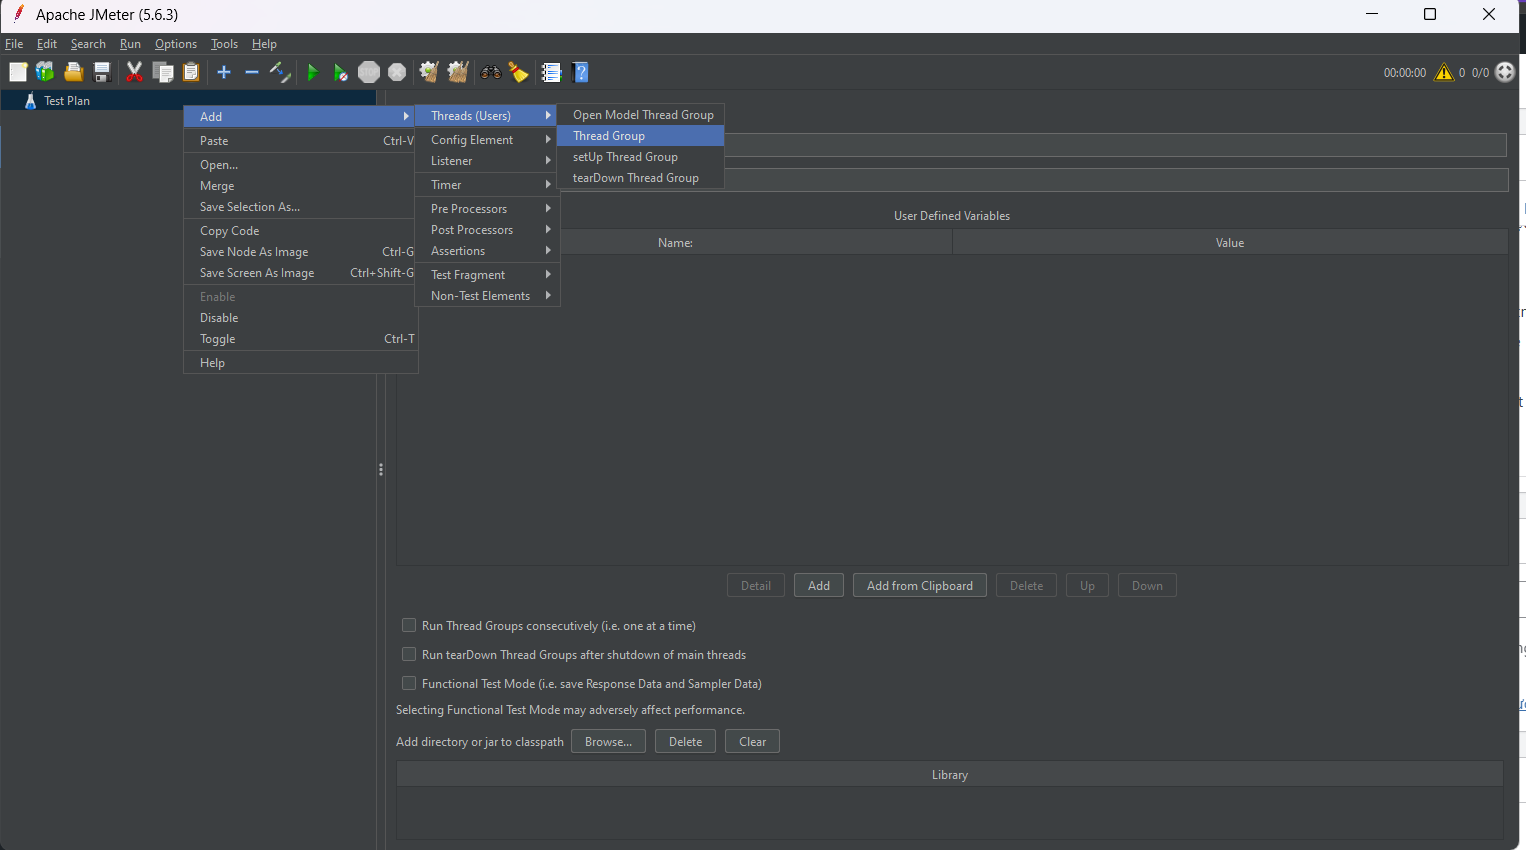
Right-click on Test Plan, select Add → Threads (Users) → Thread Group.
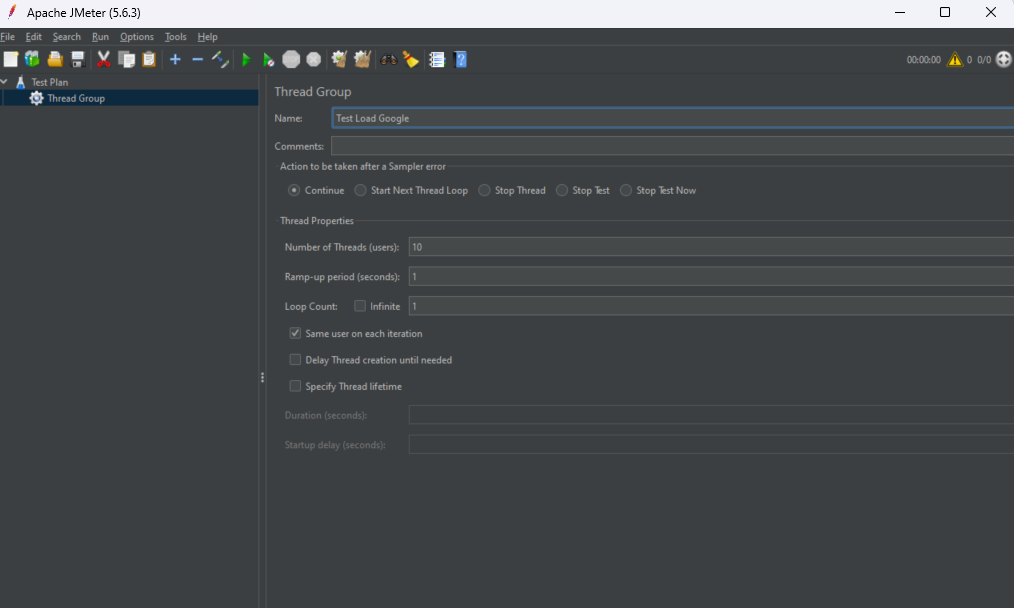
Parameters in the Thread Group:
Number of Threads (users)
The number of threads simulates the number of virtual users sending requests to the server at the same time.
Ramp-Up Period (seconds)
The time (in seconds) for all threads to fully start.
Example: If there are 10 threads and the Ramp-Up time is 100 seconds, one thread will start every 10 seconds.
Loop Count
The number of times each thread will execute all the samplers in the Thread Group.
If you select Forever, JMeter will repeat indefinitely until you stop the test.
Scheduler
Allows you to enable a scheduler to set the start and end times for the Thread Group.
Duration (seconds)
When the Scheduler is activated, this is the amount of time the Thread Group will run, from the start time.
Startup Delay (seconds)
The delay (in seconds) before starting the Thread Group after the test begins.
Action to be taken after a sampler error
Action when encountering an error from the sampler:
- Continue: Continue running the thread.
- Start Next Thread Loop: Skip the sampler and restart the thread from the beginning.
- Stop Thread, Test, Test Now: Stop the thread, the entire test, or stop all immediately when an error occurs during the running thread.
In this test example, 10 users will perform requests in 1 second and do it only once.
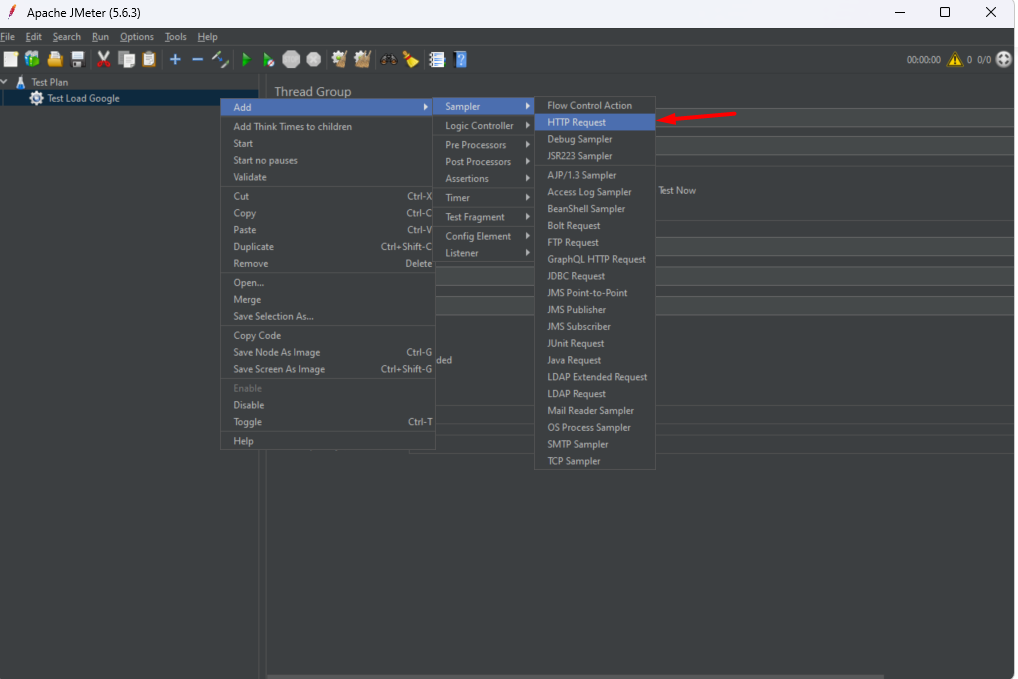
2. Creating a Request
Create an HTTP request to send to Google. If testing a database, use JDBC Request, for email use SMTP request, etc.
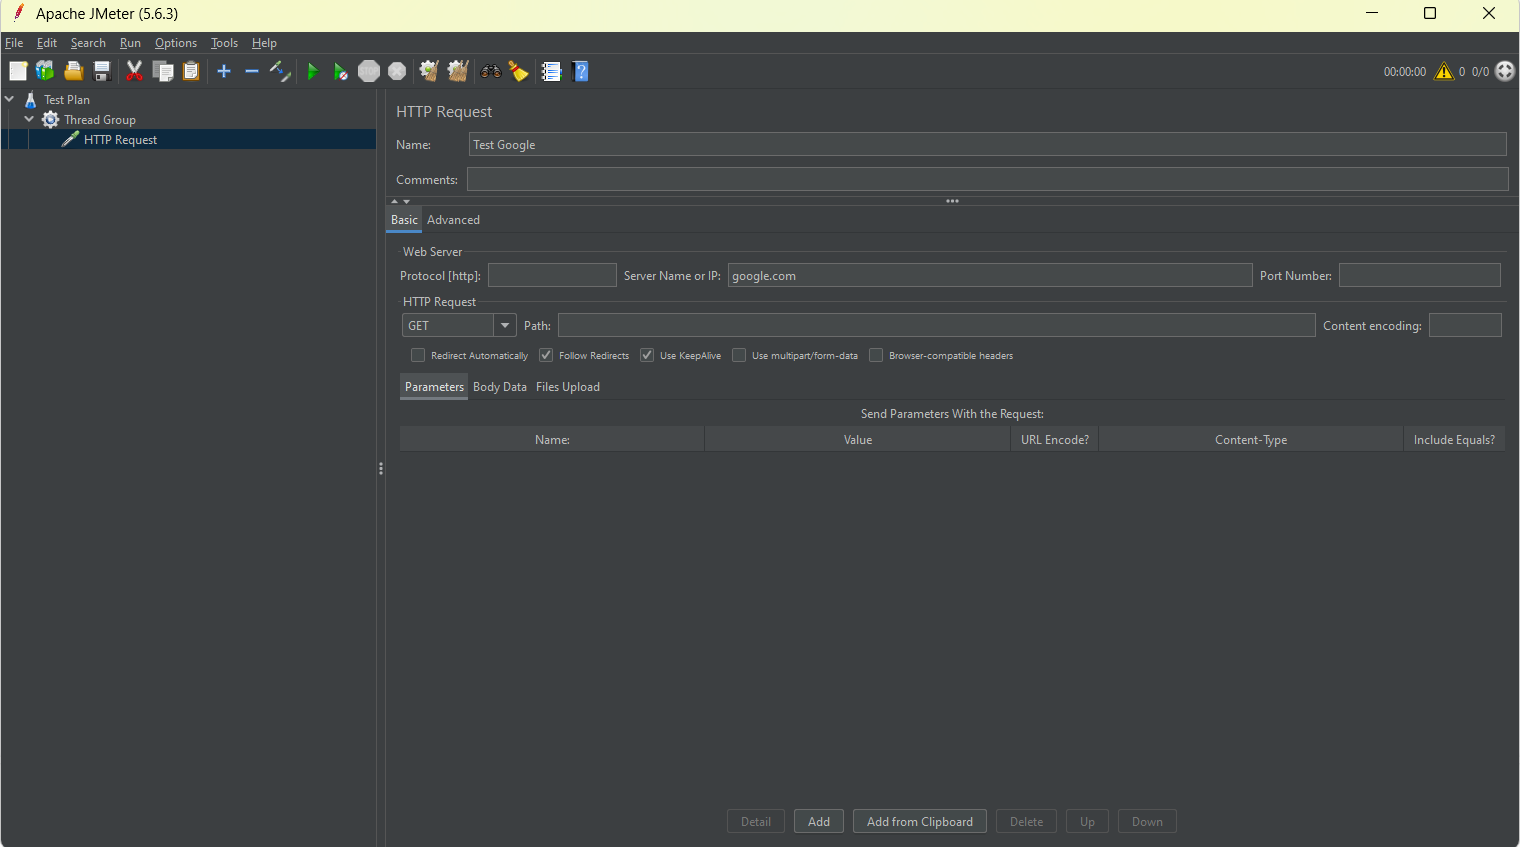
HTTP Request Parameters:
Server Name or IP
The hostname or IP address of the web server you want to send the HTTP request to.
Example: www.example.com or 192.168.1.1
Port Number
The port number the web server listens for HTTP requests. If not entered, it defaults to 80 for HTTP and 443 for HTTPS.
Protocol
The protocol used for the HTTP request, default is HTTP. You can also use HTTPS if connecting via SSL.
Method
The HTTP method used to send the request. Options include:
- GET: Retrieve a resource from the server.
- POST: Send data to the server.
- PUT: Upload or replace a resource.
- DELETE: Delete a resource.
- HEAD, OPTIONS, PATCH,…
Path
The resource path on the server you’re requesting.
Example: /api/v1/user or /login
Content Encoding
The content encoding used, usually UTF-8. Typically used when sending data (e.g., with the POST method).
Parameters
A list of parameters sent with the HTTP request, usually used with GET or POST methods. Consists of Name and Value columns.
These parameters are added to the end of the URL for GET, or in the body for POST.
Body Data
Data sent in the body of the HTTP request (usually POST). Useful when sending JSON, XML, or other formats.
Files Upload
Used when you want to upload files in the HTTP request.
3. Add Listener to Display Results
Display results of all threads.
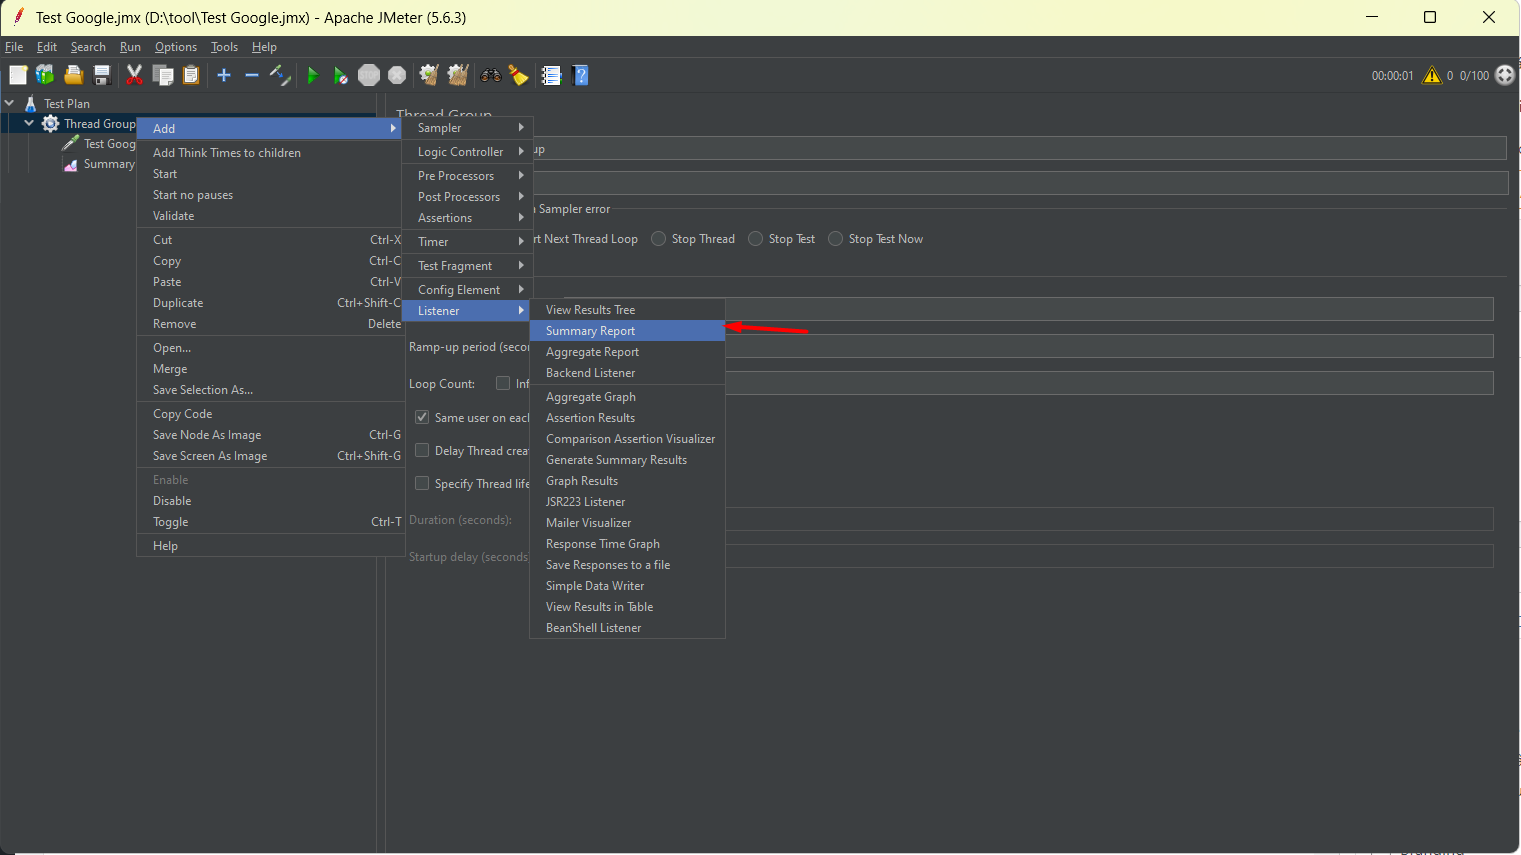
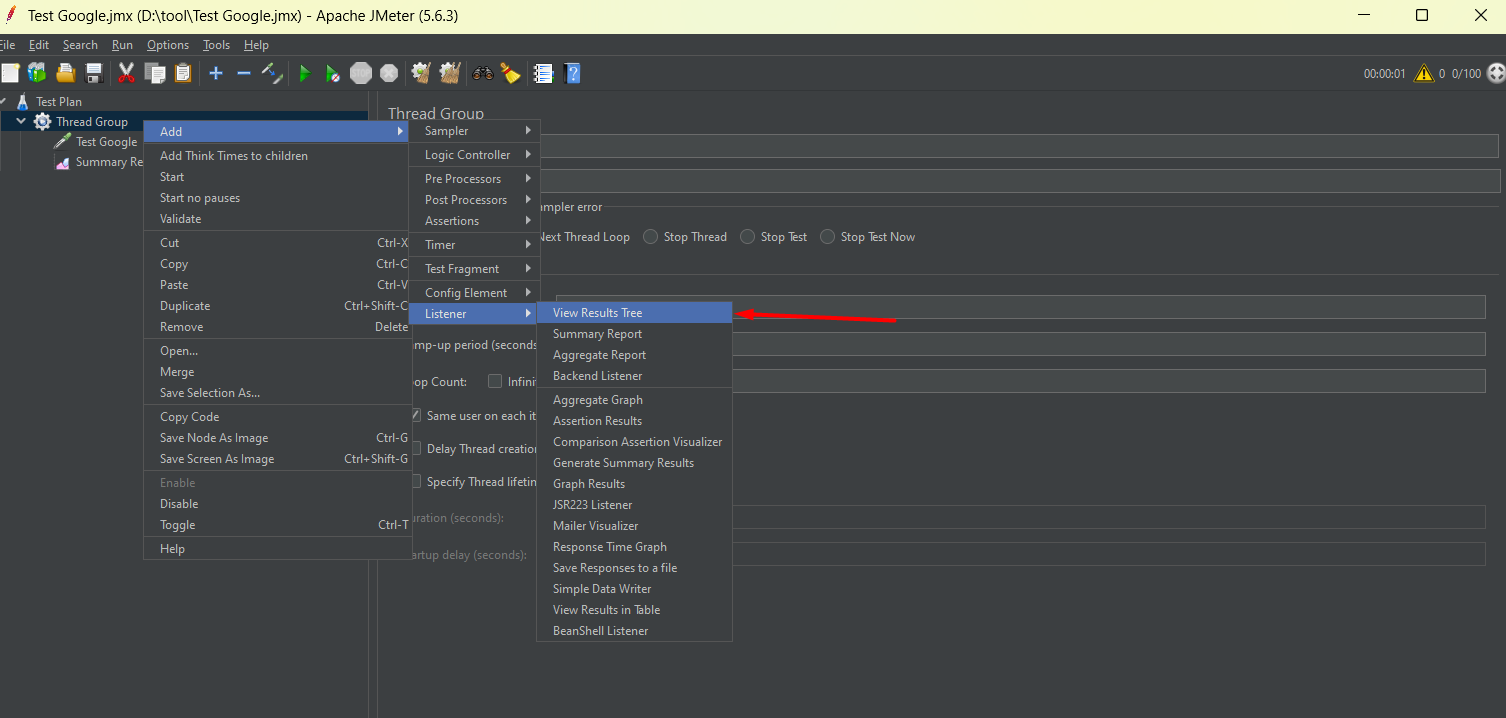
Right-click on Thread Group → Add → Listener → Summary Report.
Display results for each thread
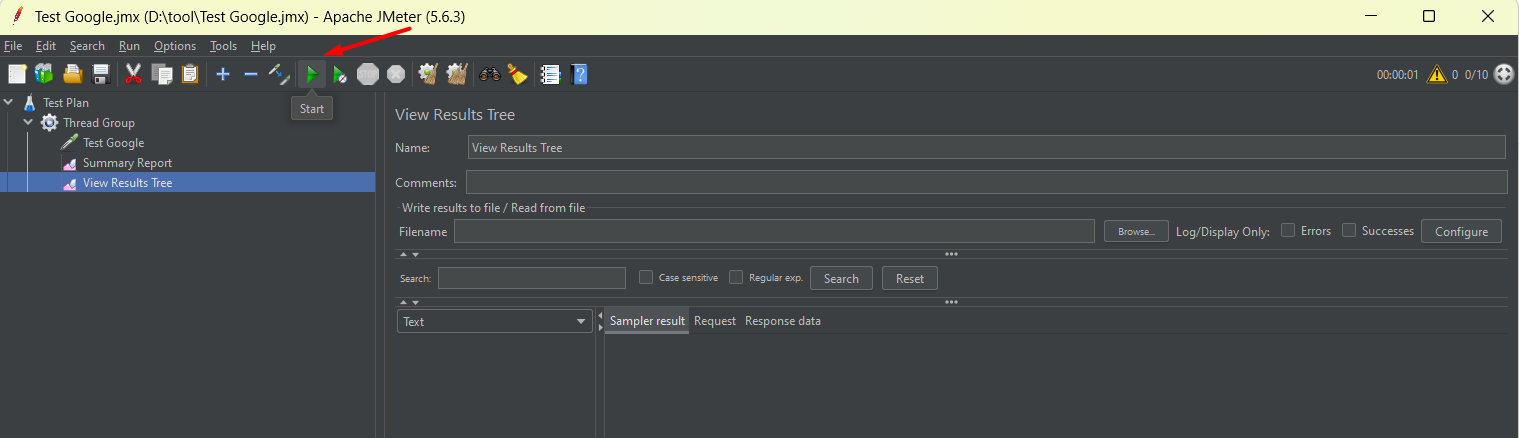
Run the test
Results:
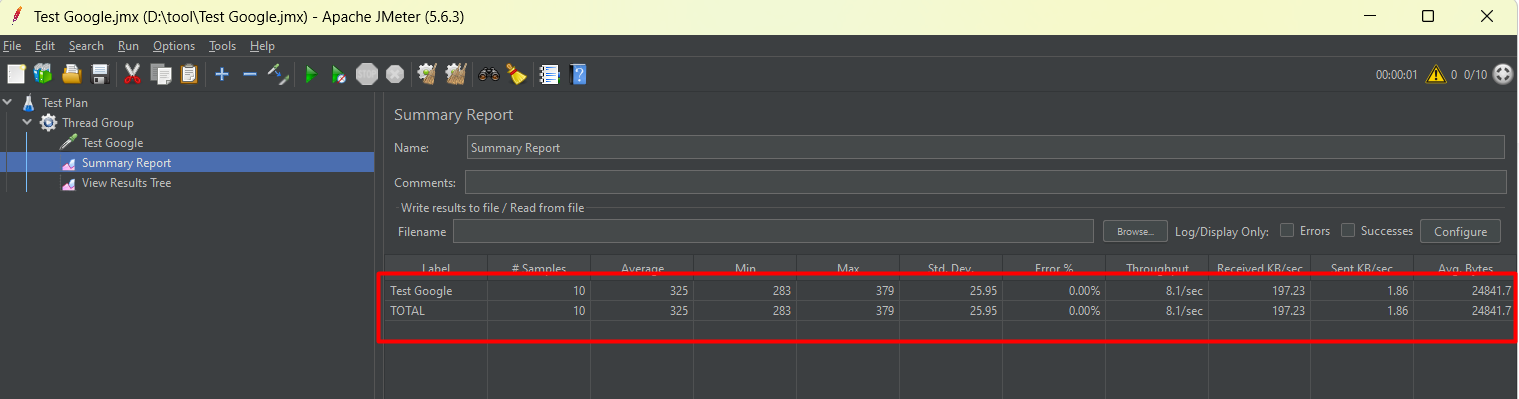
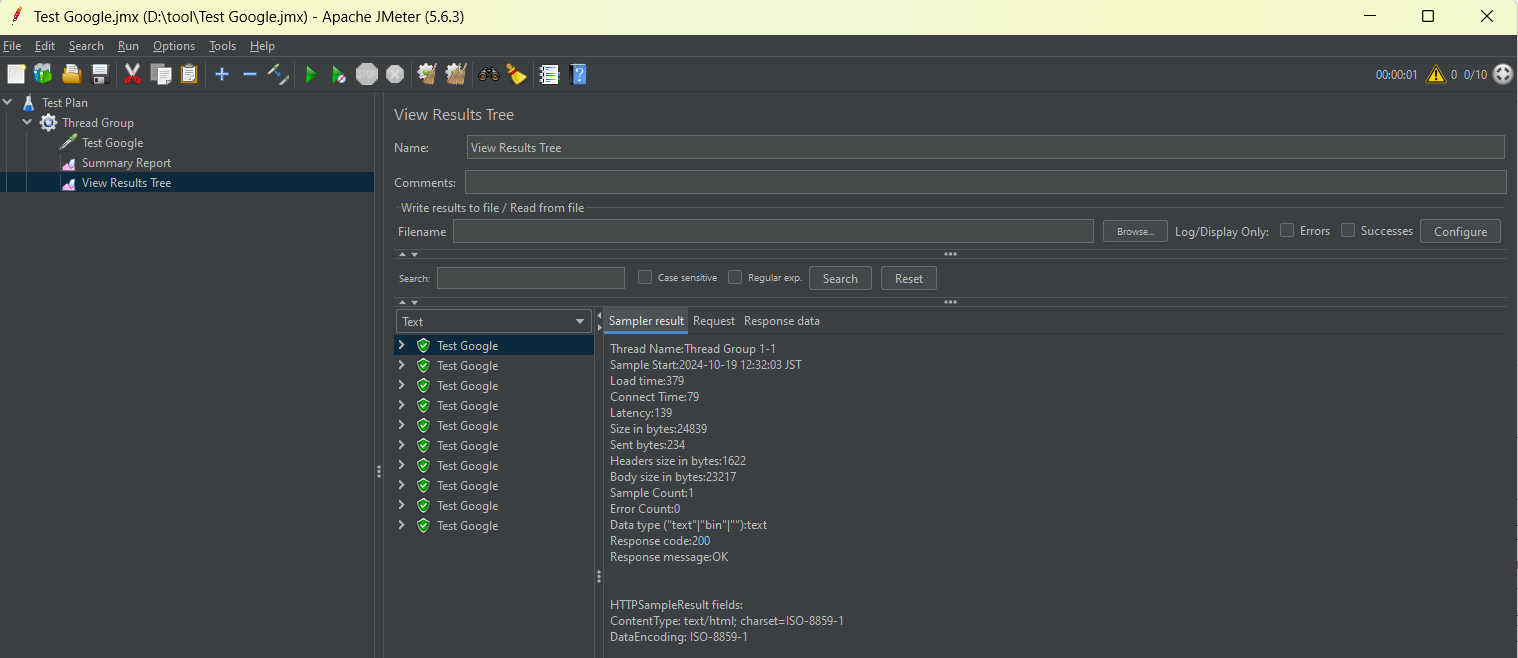
Example:
- Number of requests: 10.
- Average: the average response time from Google was 325 ms.
- Min: the fastest response time from Google was 283 ms.
- Max: the longest response time from Google was 379 ms.
- Error %: error rate is 0%.
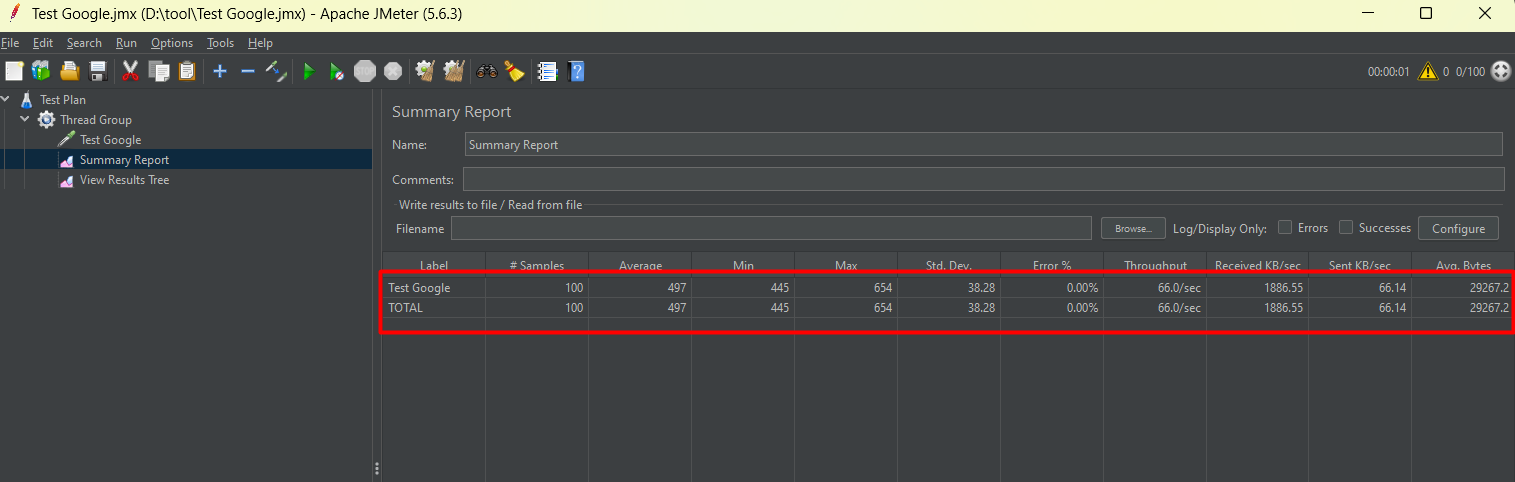
Clear the results and run again with Number of Threads (Users) = 100, meaning 100 people load Google’s page at the same time.
Results:
When 100 users send requests simultaneously, it takes more time to respond to each request than when only 10 users send requests at the same time.
VIII. Conclusion
Apache JMeter is a powerful and excellent tool for performance and load testing various types of applications. It is ideal for organizations that want to assess the capabilities of their systems without high costs.
Although there are some limitations, with continuous expansion and strong community support, JMeter remains a preferred choice for many testing projects.
For more information on Apache JMeter, you can visit the official site or use ChatGPT to learn more (learn more about ChatGPT).
 | Nguyễn Đặng Nhật Minh Developer |
APPLY NOW
Benefits

RiverCrane Vietnam sympathizes staffs' innermost feelings and desires and set up termly salary review policy. Performance evaluation is conducted in June and December and salary change is conducted in January and July every year. Besides, outstanding staffs receive bonus for their achievements periodically (monthly, yearly).


Activities such as Team Building, Company Building, Family Building, Summer Holiday, Mid-Autum Festival, etc. will be the moments worthy of remembrance for each individual in the project or the pride when one introduces the company to his or her family, and shares the message "We are One".