
Setting Up and Monitoring Systems with Prometheus/Loki/Grafana (Part 2)
In Part 1, we learned about the risks and potential impacts of not implementing a monitoring system or having an ineffective one. Additionally, we also learned how to set up a server for monitoring a system. Part 2 will continue to guide you on how to set up a server monitor to complete a monitoring system.
Deploying the System Monitoring Model (cont.)
2. Setting up the server monitor
The necessary tools: Prometheus, Loki, and Grafana
Download and installation steps
# Create a folder for prometheus
$ mkdir /usr/local/src/prometheus
# Move to the newly created folder
$ cd /usr/local/src/prometheus
# Download the latest version of Prometheus
$ wget https://github.com/prometheus/prometheus/releases/download/v2.46.0/prometheus-2.46.0.linux-amd64.tar.gz
# Extract the downloaded file
$ tar zxvf prometheus-2.46.0.linux-amd64.tar.gz
$ mv prometheus-2.46.0.linux-amd64 prometheus
# Store it in /usr/bin
$ cp -r prometheus/prometheus /usr/bin
Download the configuration file and adjust it according to the requirements
# Create a folder for config and download the config file
$ mkdir /etc/prometheus
$ cd /etc/prometheus
$ wget https://raw.githubusercontent.com/prometheus/prometheus/master/documentation/examples/prometheus.yml
Edit the configuration file to fit the guide
# my global config
global:
  scrape_interval: 15s # Set the scrape interval to every 15 seconds. Default is every 1 minute.
  evaluation_interval: 15s # Evaluate rules every 15 seconds. The default is every 1 minute.
  # scrape_timeout is set to the global default (10s).

# Alertmanager configuration
alerting:
  alertmanagers:
    - static_configs:
        - targets:
          # - alertmanager:9093

# Load rules once and periodically evaluate them according to the global 'evaluation_interval'.
rule_files:
  # - "first_rules.yml"
  # - "second_rules.yml"

# A scrape configuration containing exactly one endpoint to scrape:
# Here it's Prometheus itself.
scrape_configs:
  # The job name is added as a label `job=<job_name>` to any timeseries scraped from this config.
  - job_name: "prometheus"

    # metrics_path defaults to '/metrics'
    # scheme defaults to 'http'.

    static_configs:
      - targets: ["192.168.88.206:9090"]
  - job_name: 'node-exporter'
    static_configs:
      - targets: ["192.168.88.233:9100"]
  - job_name: 'process-exporter'
    static_configs:
      - targets: ["192.168.88.233:9256"]
Create a service file to start the service
$ vi /usr/lib/systemd/system/prometheus-node-exporter.service
Update the file content as follows
[Unit]
Description=Prometheus - Monitoring system and time series database
Documentation=https://prometheus.io/docs/introduction/overview/
After=network-online.target

[Service]
Type=simple
ExecStart=/usr/bin/prometheus \
  --config.file=/etc/prometheus/prometheus.yml \

[Install]
WantedBy=multi-user.target
Reload the daemon and start the service
# Reload daemon
$ systemctl daemon-reload$ systemctl enable prometheus.service$ systemctl start prometheus.service
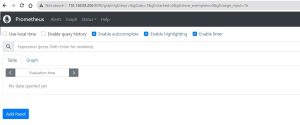
Check the status using the browser at the following URL:
http://192.168.88.206:9090
Download and installation steps
# Create a folder for loki
$ mkdir /usr/local/src/loki
# Move to the newly created folder
$ cd /usr/local/src/loki
# Download the latest version
$ curl -O -L "https://github.com/grafana/loki/releases/download/v2.8.4/loki-linux-amd64.zip"
# Extract
$ unzip "loki-linux-amd64.zip"
# Grant execute permissions for loki
$ chmod a+x "loki-linux-amd64"
# Copy to /usr/bin
$ cp -r loki-linux-amd64 /usr/bin
Download the configuration file
# Create a folder to store the loki config file
$ mkdir /etc/loki
$ cd /etc/loki
$ wget https://raw.githubusercontent.com/grafana/loki/main/cmd/loki/loki-local-config.yaml
Create a service file to start the service
$ vi /usr/lib/systemd/system/loki.service
The content of the service file is as follows
[Unit]
Description=Loki
Documentation=https://github.com/grafana/loki/releases/

[Service]
Type=simple
ExecStart=/usr/bin/loki-linux-amd64 \
  -config.file=/etc/loki/loki-local-config.yaml

[Install]
WantedBy=multi-user.target
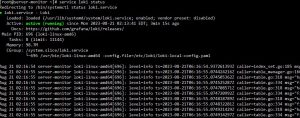
Start the service and check the status
$ service loki status
Check using the browser at the URL:
http://192.168.88.206:3100/metrics
For CentOS8, you need to create a repo for installing Grafana
$ vi /etc/yum.repos.d/grafana.repo
Content of the repo file
# Add the repo for Grafana
[grafana]
name=grafana
baseurl=https://packages.grafana.com/oss/rpm
repo_gpgcheck=1
enabled=1
gpgcheck=1
gpgkey=https://packages.grafana.com/gpg.key
sslverify=1
sslcacert=/etc/pki/tls/certs/ca-bundle.crt
Install Grafana and start the service
# Install Grafana
$ yum install grafana -y
# Start the service
$ systemctl start grafana-server
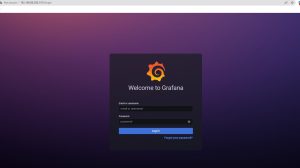
Check using the browser at the URL:
http://192.168.88.206:3100
(Default: username: admin, password: admin)
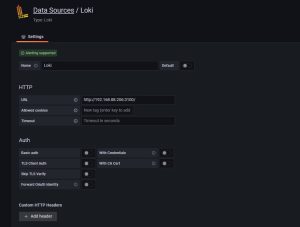
Basic Setup
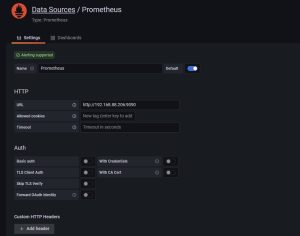
Add data sources for Prometheus and Loki
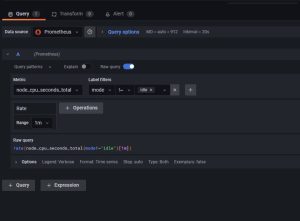
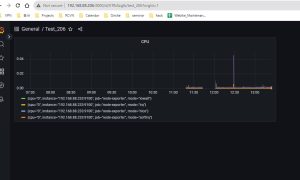
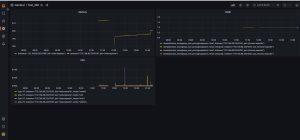
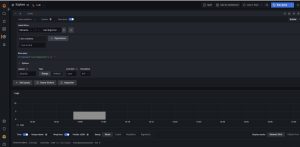
CPU
- Menu → Explore
- Data source:Prometheus
- Metric: node_cpu_seconds_total
- Label filters: mode !~ idle
- Rate: Range 1m
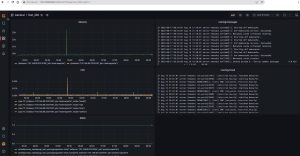
Add to Dashboard for easy monitoring
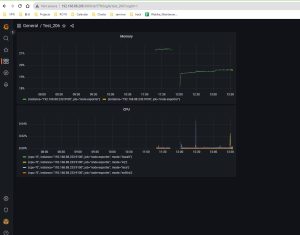
Memory
- Menu → Explore
- Data source:Prometheus
- Select mode on the right: code
- Enter code in the Metrics browser > :
- Check the result

Sshd Process
- Menu → Explore
- Data source: Prometheus
- Metric: nodeprocess_namegroup_num_procs
- Label filters: groupname =~ .*sshd.*
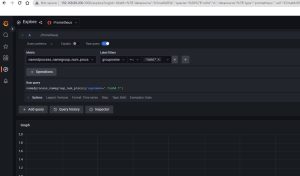
- Check the result on the Dashboard
System Logs /var/log/messages
- Data: Loki
- Label filters: filename = /var/log/messages
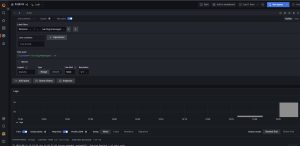
- Let’s check the result
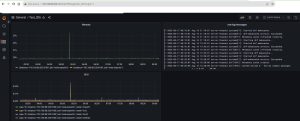
System Logs /var/log/crond
- Data: Loki
- Label filters: filename = /var/log/crond
- Let’s check the result
Summary
Overall, every system needs to have a monitoring system. Choosing the right tool from many available options requires practical testing and considering its compatibility with our system.
Grafana operates in a very intuitive and easy-to-monitor manner without requiring much effort for research. After building the monitoring infrastructure for the first time, I learned a lot of lessons, which allowed me to summarize the experience in this article for everyone to refer to.
Thank you for following the article!
 | Phan Văn Liền Web Developer |
APPLY NOW
Benefits

RiverCrane Vietnam sympathizes staffs' innermost feelings and desires and set up termly salary review policy. Performance evaluation is conducted in June and December and salary change is conducted in January and July every year. Besides, outstanding staffs receive bonus for their achievements periodically (monthly, yearly).


Activities such as Team Building, Company Building, Family Building, Summer Holiday, Mid-Autum Festival, etc. will be the moments worthy of remembrance for each individual in the project or the pride when one introduces the company to his or her family, and shares the message "We are One".