
System Setup and Monitoring with Prometheus / Loki / Grafana (Part 1)
Lack of System Monitoring: Risks and Impacts
Low Performance and Hidden Issues
Without a monitoring system, we will not be able to identify potential issues affecting performance. Without a mechanism to track and record performance-related data, problems such as “slow processing speed”, “overutilized resources”, and “longer response times” may go unnoticed. This can lead to unexpected incidents and even work disruptions.
Poor Forecasting and Planning
Without monitoring, there is no data to help a business forecast potential issues and plan for the future. Monitoring data helps define growth trends and changes in system performance. Without this information, resource planning, infrastructure scaling, and optimization will be difficult. This could lead to wasted resources and hinder the ability to quickly respond to changing demands.
Poor Investigation and Troubleshooting
When incidents or issues occur, lack of data will make it difficult to identify the cause and resolve the issue. The absence of information about system activity before, during, and after an incident increases the time needed to pinpoint the root cause and take corrective action. This can lead to unnecessary investigation time, affecting customer satisfaction and the organization’s reputation.
Lack of Monitoring and Alerting Capabilities
Unmonitored systems can miss important situations that require immediate intervention. Without an alert mechanism or dashboard to monitor critical metrics, issues like resource depletion, security breaches, and other risks can go undetected. This can have serious consequences for system stability and security.
Prometheus, Loki, and Grafana: Solutions for System Monitoring
Furthermore, setting up a monitoring system using these tools will help businesses improve their forecasting capabilities, troubleshoot issues, and monitor and detect potential security problems.
What is Prometheus?
Prometheus is an open-source project that has changed the way we approach system monitoring. With its ability to collect data on the performance and resilience of systems from various sources, Prometheus allows us to monitor and analyze systems more flexibly and accurately.
Prometheus collects metrics about system resources, applications, and other components. These metrics are then used to create alerts, statistics, and charts to monitor the system’s development.
Prometheus collects and stores its metrics as time series data, meaning the metric information is stored with a timestamp at which it was recorded, along with optional key-value pairs known as labels.
What is Loki?
An important component of system monitoring is log tracking. Loki, a project designed from Prometheus, focuses on collecting, tracing, and analyzing system logs.
Loki is designed to allow us to search, filter, and trace logs from various sources efficiently. By combining Prometheus and Loki, businesses can capture both the numerical and log aspects of the system, creating a comprehensive and detailed picture of the system’s status.
What is Grafana?
Monitoring and having data is useful, but turning that data into meaningful information that the business can visualize is the task of Grafana.
Grafana is a powerful data visualization platform. It helps create dashboards and graphs from data and metrics obtained from devices, enabling information to be observed in a visual and efficient manner.
The combination of Prometheus, Loki, and Grafana allows businesses to create integrated dashboards, providing an overall view of the system’s status and easily identifying potential problems and security risks, creating a robust system that sets the foundation for sustainable development in today’s organizations and businesses.
Implementing a Monitoring Model
In this guide, we will set up a basic monitoring system for the following information sources:
- CPU usage rate of the server
- Memory usage rate of the server
- Monitor the sshd process
- System logs /var/log/messages
- Cron job logs
Tools used:
- Prometheus: A tool for collecting and visualizing metrics from server services and apps
- Loki: Logs and queries for the system
- Grafana: A tool for turning data into a user-friendly interface
- Node Exporter:
- A tool for collecting metrics
- Transmits data from the monitored server to the monitoring server, with specific setup to receive Process Export information from the monitored server
- Promtail
- A tool for formatting logs
- Set up to format logs from the monitored server to the monitoring server
- Demo server structure
| Server Name | Server IP | Configuration | Tools Used |
| Monitored Server | 192.168.88.233 | OS: Centos8 RAM: 2GB CPU: 2Core | ・Node Exporter ・Process Exporter ・Promtail |
| Monitor Server | 192.168.88.206 | OS: Centos8 RAM: 2GB CPU: 2Core | ・Grafana ・Loki ・Prometheus |
Setup Sequence
1. Setting up the monitored server
Install necessary tools such as Node Exporter, Process Exporter, and Promtail
Download the latest version from Prometheus
# Create folder to use for downloading source
$ mkdir /usr/local/src/prometheus
# Move to the newly created folder
$ cd /usr/local/src/prometheus
# Download the compressed file of the source
$ wget https://github.com/prometheus/node_exporter/releases/download/v1.6.1/node_exporter-1.6.1.linux-amd64.tar.gz
# Unzip the downloaded file
$ tar zxvf node_exporter-1.6.1.linux-amd64.tar.gz
$ mv node_exporter-1.6.1.linux-amd64.tar.gz node_exporter
# Store it in /usr/bin
$ cp -r node_exporter /usr/bin
Create start script
# Create start script
$ vi /usr/lib/systemd/system/prometheus-node-exporter.service
Content of prometheus-node-exporter.service:
[Unit]
Description=Node Exporter
Documentation=https://github.com/prometheus/node_exporter
[Service]
Type=simple
ExecStart=/usr/bin/node_exporter/node_exporter $OPTIONS
Restart=always
[Install]
WantedBy=multi-user.target
Start and check the service status
# Reload daemon
$ systemctl daemon-reload
# Enable automatic restart service
$ systemctl enable prometheus-node-exporter.service
# Start the service
$ systemctl start prometheus-node-exporter.service
# Check service status
$ systemctl status prometheus-node-exporter.service
Check the result
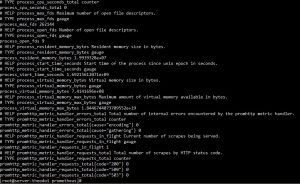
# Test API check
$ curl 192.168.88.233:9100/metrics
Test results as shown are correct
Download and install the latest version from Process Exporter
# Create a folder to download source
$ mkdir /usr/local/src/process-exporter
# Move to the source folder you created
$ cd /usr/local/src/process-exporter
# Download the compressed file of the source
$ wget https://github.com/ncabatoff/process-exporter/releases/download/v0.7.10/process-exporter-0.7.10.linux-amd64.tar.gz
# Unzip the downloaded file
$ tar zxvf process-exporter-0.7.10.linux-amd64.tar.gz
$ mv process-exporter-0.7.10.linux-amd64 process-exporter
# Store it in /usr/bin
$ cp -r /usr/local/src/process-exporter/process-exporter /usr/bin
# Create a folder for config files for process exporter
$ mkdir /etc/process-exporter
# Create the config file
$ vi /etc/process-exporter/config.yml
Write the script content into the config file process-exporterconfig.yml
# Write content to the file
$ vi /etc/process-exporter/process-exporterconfig.yml
Content is as follows:
process_names:
  - cmdline:
    - .+
Create a start script
# Create a start script
$ vi /usr/lib/systemd/system/process-exporter.service
The content of process-exporter.service is as follows
[Unit]
Description=Process Exporter
Documentation=https://github.com/ncabatoff/process-exporter
[Service]
Type=simple
ExecStart=/usr/bin/process-exporter/process-exporter \
  -config.path /etc/process-exporter/config.yml
[Install]
WantedBy=multi-user.target
Start and check the service status
# Reload and start
$ systemctl daemon-reload
$ systemctl enable process-exporter.service
$ systemctl start process-exporter.service
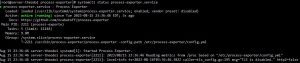
$ systemctl status process-exporter.service
Check the service status as shown below to confirm success
Check the result
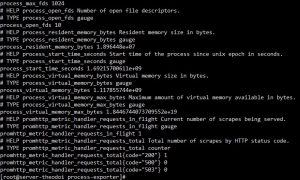
# Test the API
$ curl 192.168.88.233:9256/metrics
Test results as shown are correct
Download and install the latest version from Grafana/Loki
# Create folder to use for downloading source
$ mkdir /usr/local/src/promtail
# Move to the source folder you created
$ cd /usr/local/src/promtail
# Download the compressed file of the source
$ curl -O -L "https://github.com/grafana/loki/releases/download/v2.8.4/promtail-linux-amd64.zip"
# Unzip the downloaded file
$ unzip "promtail-linux-amd64.zip"
# Grant execution permissions to the file
$ chmod a+x promtail-linux-amd64
# Store it in /usr/bin
$ cp -r /usr/local/src/promtail/promtail-linux-amd64 /usr/bin
Download the config file promtail-local-config.yaml
# Create folder to use for downloading the file
$ mkdir /etc/promtail
# Move to the source folder you created
$ cd /etc/promtail
# Download the config file
$ wget https://raw.githubusercontent.com/grafana/loki/main/clients/cmd/promtail/promtail-local-config.yaml
Edit the configuration file promtail-local-config.yaml accordingly
- Update the IP of the monitor server to push data from the monitored server (the monitor server here uses IP: 192.168.88.206)
- Set up to collect logs from the system and cron job logs:
/var/log/messages and /var/log/crond - Edit the configuration file /etc/promtail/promtail-local-config.yaml as follows:
server:
http_listen_port: 9080
grpc_listen_port: 0
positions:
filename: /tmp/positions.yam
clients:
- url: http://192.168.88.206:3100/loki/api/v1/push
scrape_configs:
- job_name: system
static_configs:
- targets:
- localhost
labels:
job: varlogs
      __path__: /var/log/messages
- job_name: cron
  static_configs:
  - targets:
     - localhost
    labels:
      job: cronlogs
      __path__: /var/log/cron
Create start script
$ vi /usr/lib/systemd/system/promtail.service
The content of the script promtail.service is as follows
[Unit]
Description=Promtail
Documentation=https://github.com/grafana/loki/releases/
[Service]
Type=simple
ExecStart=/usr/bin/promtail-linux-amd64 \
  --config.file=/etc/promtail/promtail-local-config.yaml
[Install]
WantedBy=multi-user.target
Reload and check the result
# Reload and start
$ systemctl daemon-reload
$ systemctl enable promtail.service
$ systemctl start promtail.service
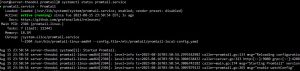
$ systemctl status promtail.service
Check the service status as shown below to confirm success
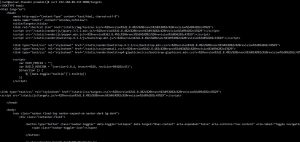
Check the result using API
# Test the API
$ curl 192.168.88.233:9080/targets
The result should appear as shown
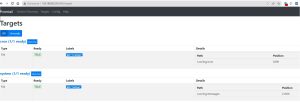
Verify that Promtail is working in the browser (Chrome) at the address
http://192.168.88.233:9080/targets
End of Part 1
*In Part 2, we will discuss how to set up the server monitor. Stay tuned for the next article!
 | Phan Văn Liền Web Developer |
APPLY NOW
Benefits

RiverCrane Vietnam sympathizes staffs' innermost feelings and desires and set up termly salary review policy. Performance evaluation is conducted in June and December and salary change is conducted in January and July every year. Besides, outstanding staffs receive bonus for their achievements periodically (monthly, yearly).


Activities such as Team Building, Company Building, Family Building, Summer Holiday, Mid-Autum Festival, etc. will be the moments worthy of remembrance for each individual in the project or the pride when one introduces the company to his or her family, and shares the message "We are One".